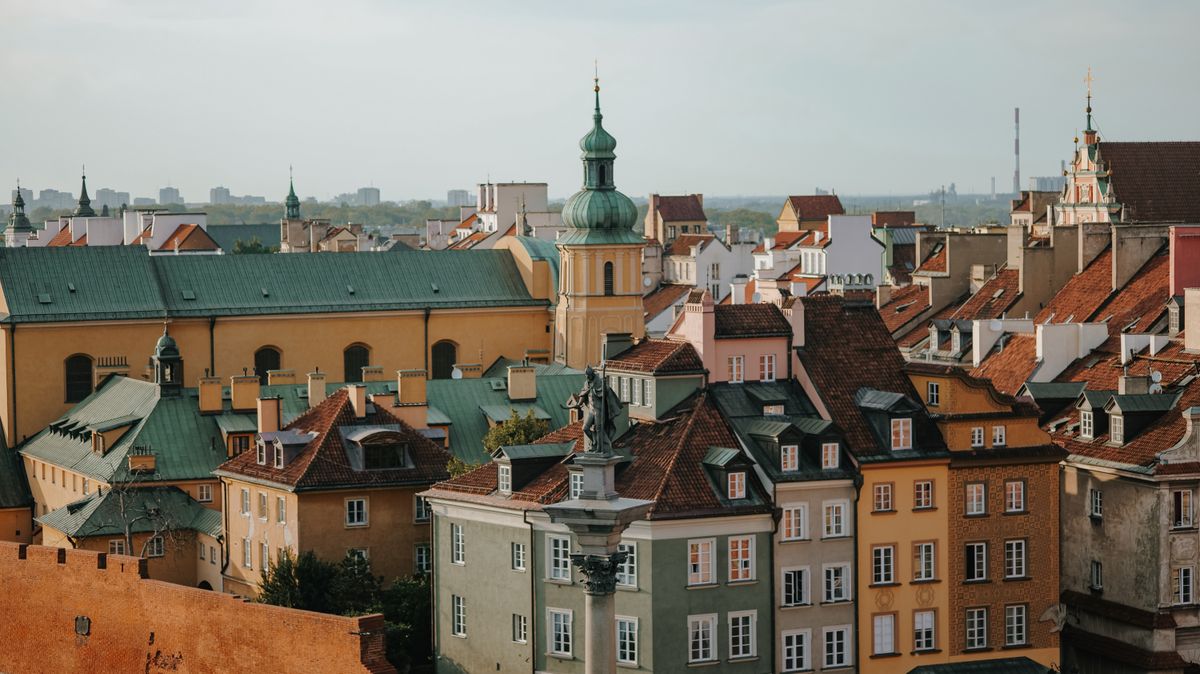
 Poland
 United States
Compare countries · Poland vs United States
Poland vs United States
 PolandCentral Europe
 United StatesNorth America
Poland is cheaper (cost of living 47.3 vs 68.8) and more peaceful (Global Peace Index 1.615 vs 2.535).The United States scores higher on human development (0.938 vs 0.906) and has the higher income per person ($88,810 vs $25,520).About the same on life expectancy (Poland 78.4, the United States 78.9 years).
Poland is the more peaceful
- Global Peace Indexlower is more peaceful
- Poland1.615Very high safety#22 of 161IEP GPI · 2026
- United States2.535Low safety#133 of 161IEP GPI · 2026
- Homicidesper 100,000 people a year
- Poland0.8LowUNODC / World Bank · 2023
- United States5.8HighUNODC / World Bank · 2023
- Safety indexNumbeo's safety index, higher is safer
- Poland71.3HighNumbeo · 2026
- United States50.8ModerateNumbeo · 2026
- UK travel adviceFCDO, for British travellers
- PolandNo advice against travelFCDO foreign travel advice, GOV.UK · read 2026-10-12
- United StatesNo advice against travelFCDO foreign travel advice, GOV.UK · read 2026-10-12
Income per person is higher in the United States
- GNI per personnational income per person, US dollars
- Poland$25,520HighWorld Bank · 2025
- United States$88,810Very highWorld Bank · 2025
- Cost of living indexexcluding rent, New York = 100
- Poland47.3AffordableNumbeo · 2026
- United States68.8ExpensiveNumbeo · 2026
Life expectancy: the United States 78.9, Poland 78.4
- Life expectancyyears, at birth
- Poland78.4High#48 of 195World Bank · 2024
- United States78.9High#47 of 195World Bank · 2024
Broadband is faster in the United States
- Fixed broadbandmedian download speed
- Poland218 MbpsVery fast#25 of 149Ookla Speedtest · 2025
- United States308 MbpsVery fast#6 of 149Ookla Speedtest · 2025
- Youth unemploymentshare of 15 to 24 year olds in the labour force
- Poland12.2%LowEurostat · 2025
- United StatesNo figure from Eurostat
Human development: United States 0.938, Poland 0.906
PolandUnited States
UNDP Human Development Report, 1990–2023.
Year by year:PolandUnited States
Practical facts
- Capital
- Warsaw
- Washington, D.C.
- Population
- 36.4M (2025)
- 341.8M (2025)
- Languages
- Polish
- English
- Currency
- Polish złoty (PLN)
- United States dollar (USD)
- Area
- 306,270 km²
- 9,147,420 km²
- Plug type
- Type C/E
- Type A/B
- Drives on the
- right
- right
- Short visit
- Visa-free for UK, EU and US passports
- Visa-free for UK and EU; visa needed for US
Short visits: passport-index-dataset, 2024, for UK, EU (German) and US passports. Population and area: World Bank. Languages, currency and driving side: restcountries.com. Plug types: worldstandards.eu.
Poland and United States, side by side
Poland leads on 30 United States on 298 level117 figures. 13 are held for only one country; the other shows a dash. Rows such as population, religion and tax levels have no better or worse end, so they show both values and no verdict. Level means under 2% apart.
Money and cost27
- Median IncomeEurostat · 2025
- €14,394Low
- —
- PPP / Cap aheadWorld Bank · 2025
- $54,262High
- $90,027High
- GDP / Cap aheadWorld Bank · 2025
- $28,420High
- $90,027Very high
- GNI / Cap aheadWorld Bank · 2025
- $25,520High
- $88,810Very high
- Local purchasing power aheadNumbeo · 2026
- 97.1High
- 146Very high
- Cost of Living aheadNumbeo · 2026
- 47.3Affordable
- 68.8Expensive
- Cost of living with rent aheadNumbeo · 2026
- 34.4High
- 56.3Very high
- Rent index aheadNumbeo · 2026
- 18.4Expensive
- 40.7Very expensive
- Groceries index aheadNumbeo · 2026
- 41.1Moderate
- 74Very high
- Restaurant prices index aheadNumbeo · 2026
- 48.1High
- 72.8Very high
- Property Price-to-Income aheadNumbeo Property Investment · 2026
- 10.2Affordable
- 3.5Very affordable
- Price level ratio aheadWorld Bank ICP
- 0.933High
- 1.701Very high
- Housing OverburdenEurostat · 2025
- 4.1%Very low
- —
- Electricity PriceEurostat · 2025
- €0.271Expensive
- —
- Energy PovertyEurostat · 2025
- 3.2%Very low
- —
- Inflation aheadWorld Bank · 2024–2025
- 3.8%High
- 2.9%Moderate
- Pension Replacement aheadOECD Pensions at a Glance · 2024
- 28.6%Very low
- 39.7%Low
- Bank Account aheadWorld Bank Global Findex · 2024
- 86.1%High
- 97%Very high
- Send RemittanceWorld Bank Remittance Prices Worldwide · 2023
- —
- 3.5%Moderate
- Tax WedgeOECD Taxing Wages · 2025
- 35%
- 30%
- Top Income TaxWikipedia · 2024
- 41%
- 51.8%
- Corporate TaxWikipedia · 2024
- 19%
- 21%
- VAT / GSTWikipedia · 2024
- 23%
- —
- Tax RevenueWorld Bank · 2023–2024
- 18%
- 10.8%
- GDP (total)World Bank · 2025
- $1,036 bn
- $30,770 bn
- FDI InflowsWorld Bank · 2025
- 1.9%
- 1.3%
- Innovation aheadWIPO Global Innovation Index · 2025
- 37.7High
- 61.7Very high
Work4
- UnemploymentWorld Bank · 2025
- 3%
- 4.2%
- Youth UnemploymentEurostat · 2025
- 12.2%Low
- —
- Long Work Hours aheadOECD Better Life Index · 2020
- 4.2%Moderate
- 10.4%High
- Public Holidaysdate.nager.at · 2025
- 14
- 12
Equality7
- Income Inequality aheadWorld Bank · 2023–2024
- 28.5Very low
- 41.8Very high
- Income Share Bot. 20% aheadWorld Bank · 2023–2024
- 8.6High
- 5.1Very low
- Income Share Top 10% aheadWorld Bank · 2023–2024
- 22.9Very low
- 30.7High
- Poverty Rate aheadWorld Bank · 2023–2024
- 1.1%Very low
- 1.8%Low
- Poverty RiskEurostat · 2025
- 13.2%Very low
- —
- Gender Inequality aheadUNDP Human Development Report · 2023
- 0.081Very low
- 0.169Low
- Inequality-Adj. HDILevelUNDP HDR
- 0.817High
- 0.832Very high
Safety10
- Peace Index aheadIEP Global Peace Index · 2026
- 1.615Very high safety
- 2.535Low safety
- Safety aheadNumbeo · 2026
- 71.3High
- 50.8Moderate
- Homicides / 100k aheadUNODC / World Bank · 2023
- 0.8Low
- 5.8High
- Crime PerceptionEurostat · 2023
- 2.8%Very low
- —
- Assault Rate aheadUNODC CTS · 2022–2023
- 13.3Low
- 277.9Very high
- Robbery Rate aheadUNODC CTS · 2022–2024
- 11Low
- 63.2High
- Sexual Violence RateUNODC CTS · 2023
- 9.1Low
- —
- Kidnapping Rate aheadUNODC CTS · 2015–2022
- 0.64Moderate
- 15.4Very high
- Road Deaths / 100k aheadWHO GHO · 2021
- 6.5Low
- 14.2Moderate
- Disaster Risk aheadWorld Risk Index · 2022
- 4.6Moderate
- 22.7Very high
Health16
- Life ExpectancyLevelWorld Bank · 2024
- 78.4High
- 78.9High
- Infant Mortality aheadWorld Bank · 2024
- 3.6Very low
- 5.5Low
- Healthcare Quality aheadNumbeo · 2026
- 57.9Fair
- 67Good
- UHC Service Coverage aheadWHO GHO · 2023
- 82High
- 88Very high
- Physicians / 1k aheadWorld Bank · 2022–2023
- 4Very high
- 3.7High
- Hospital Beds aheadWorld Bank · 2022
- 6Very high
- 2.7Moderate
- Out-of-Pocket Health % aheadWorld Bank · 2023–2024
- 16.2%Low
- 10.9%Very low
- Healthcare SpendWorld Bank · 2023–2024
- $2,014
- $13,473
- Clean Water aheadWorld Bank · 2024
- 90.1%Low
- 100%Very high
- PM2.5 concentration aheadWHO GHO · 2023
- 14.7Moderate
- 9.8Low
- Air-pollution Deaths / 100k aheadWHO GHO · 2021
- 41.2Low
- 15.9Very low
- Obesity aheadWHO GHO · 2024
- 21.8%Moderate
- 41%Very high
- Tobacco Use aheadWHO GHO · 2020–2023
- 23.8%High
- 16.2%Low
- Raised Blood Glucose aheadWHO GHO · 2014
- 7.7%Moderate
- 7.3%Low
- Suicide Rate / 100k aheadWHO GHO · 2021
- 13.7High
- 15.6Very high
- Alcohol L / capitaWHO GHO · 2024
- 11.5
- 9.6
Education and getting online9
- Tertiary EducationEurostat · 2025
- 40%Moderate
- —
- PISA Math aheadOECD PISA Results · 2022
- 489Very high
- 465Moderate
- PISA Reading aheadOECD PISA Results · 2022
- 489Very high
- 504Very high
- PISA ScienceLevelOECD PISA Results · 2022
- 499Very high
- 499Very high
- Education SpendWorld Bank · 2021–2022
- 4.3%
- 5.4%
- English Proficiency aheadEF English Proficiency Index · 2025
- 600Very high
- 700Native
- Internet aheadWorld Bank · 2024
- 88.6%High
- 94.7%Very high
- Fixed broadband aheadOokla Speedtest Global Index · 2025
- 218 MbpsVery fast
- 308 MbpsVery fast
- Mobile internet aheadOokla Speedtest Global Index · 2025
- 114 MbpsModerate
- 212 MbpsVery high
Governance and freedom8
- Rule of Law aheadWorld Bank WGI · 2025
- 0.57High
- 0.79High
- Corruption aheadWorld Bank WGI · 2025
- 0.85High
- 0.87Very high
- Political Stability aheadWorld Bank WGI · 2025
- 0.69High
- -0.30Low
- Government Effectiveness aheadWorld Bank WGI · 2025
- 0.80High
- 1.19Very high
- Regulatory Quality aheadWorld Bank WGI · 2025
- 0.79Very high
- 1.01Very high
- DemocracyLevelEIU Democracy Index · 2025
- 7.7High
- 7.7High
- Freedom HouseLevelFreedom House · 2025
- 82High
- 81High
- Press Freedom aheadRSF World Press Freedom Index · 2026
- 75.5Good
- 62.6Satisfactory
Quality of life10
- Human Development aheadUNDP Human Development Report · 2023
- 0.906Very high
- 0.938Very high
- HappinessLevelWorld Happiness Report · 2026
- 6.77Moderate
- 6.82Moderate
- Quality of life index aheadNumbeo · 2026
- 156.1Moderate
- 186Very high
- Climate indexLevelNumbeo · 2026
- 75.7Good
- 75.8Good
- WHR: GDPWorld Happiness Report · 2026
- 1.851
- 2
- WHR: Social SupportWorld Happiness Report · 2026
- 1.479
- 1.516
- WHR: Healthy Life Exp.World Happiness Report · 2026
- 0.693
- 0.678
- WHR: FreedomWorld Happiness Report · 2026
- 0.945
- 0.776
- WHR: GenerosityWorld Happiness Report · 2026
- 0.023
- 0.155
- WHR: Corruption TrustWorld Happiness Report · 2026
- 0.177
- 0.155
People and planet23
- PopulationWorld Bank · 2025
- 36,435,861
- 341,784,857
- AreaWorld Bank
- 306,270 km²
- 9,147,420 km²
- Median AgeWorld Bank age-group shares
- 42.4
- 40.5
- Population GrowthWorld Bank · 2025
- -0.34%
- 0.52%
- Urban PopulationWorld Bank · 2025
- 60.1%
- 80.2%
- Net MigrationWorld Bank · 2025
- -330,820
- 1,230,663
- Foreign-Born %UN DESA International Migrant Stock · 2024
- 4.5%
- 15.2%
- Fertility RateWorld Bank · 2024
- 1.14
- 1.63
- Avg Household SizeOECD Family Database · 2024
- 2.3
- 2.5
- Single-Person HouseholdsOECD Family Database · 2021
- 23.4%
- 27.6%
- Lone-Parent HouseholdsOECD Family Database · 2021
- 6%
- 6.8%
- ChristianPew Research · 2020
- 91.2%
- 64%
- MuslimPew Research · 2020
- 0%
- 1.2%
- HinduPew Research · 2020
- 0%
- 0.9%
- BuddhistPew Research · 2020
- 0%
- 1.3%
- JewishPew Research · 2020
- 0%
- 1.7%
- UnaffiliatedPew Research · 2020
- 8.6%
- 29.7%
- Other religionsPew Research · 2020
- 0.1%
- 1.2%
- CO₂ / Capita aheadWorld Bank · 2024
- 7.6Very high
- 13.6Very high
- Renewables aheadWorld Bank · 2021
- 15.2%Low
- 10.9%Low
- Forest CoverWorld Bank · 2023
- 31.1%
- 33.9%
- Climate VulnerabilityLevelND-GAIN Country Index · 2023
- 0.306Very low
- 0.312Very low
- Climate Readiness aheadND-GAIN Country Index · 2023
- 0.536High
- 0.647Very high
Other3
- Unmet Medical NeedEurostat · 2025
- 2.9%
- —
- Receive RemittanceWorld Bank Remittance Prices Worldwide · 2023
- 0.9%
- —
- Leisure TimeOECD Better Life Index · 2020
- 14.7
- 14.6
Quick answers
Is Poland cheaper than United States?
Numbeo's 2026 cost-of-living index (NYC = 100) puts Poland at 47.3 and United States at 68.8. Poland is about 31% cheaper overall.
Is Poland or United States safer?
On the Global Peace Index (lower = more peaceful), Poland scores 1.61 and United States scores 2.54. Poland ranks as the more peaceful of the two.
Which has the higher quality of life, Poland or United States?
On the UN Human Development Index, Poland scores 0.906 and United States scores 0.938. United States scores higher on this composite of income, health and education. Single indexes hide trade-offs; the full comparison above shows where each country wins.
What is life like in Poland compared to United States?
GNI per capita runs $25,520 in Poland against $88,810 in United States; people live 78.4 years on average against 78.9; Numbeo users rate healthcare 58 against 67. Those are national averages and they hide the thing you actually feel: capital-city costs run well ahead of the national figure in most countries, and rural provision of healthcare and internet often lags the number shown here. The table below splits it indicator by indicator.